I plotted the trend of confirmed cases of Coronavirus for the main European countries. For each country, the latest observation corresponds to the number of cases on 13th March 2020.
The Y-axis reports the number of cases per million inhabitants. This means, for example, that in the case of Italy, the value of 291 cases on day 21 corresponds roughly to the total number of 17,660 cases (291 multiplied by 60,68) reported on 13 March 2020. For a country like Denmark, the peak of 142.5 cases corresponds roughly to the total of 801 confirmed cases on 13 March (142,5 multiplied by 5.6).
The plot on the right corresponds to the first 14 days in the plot on the left.
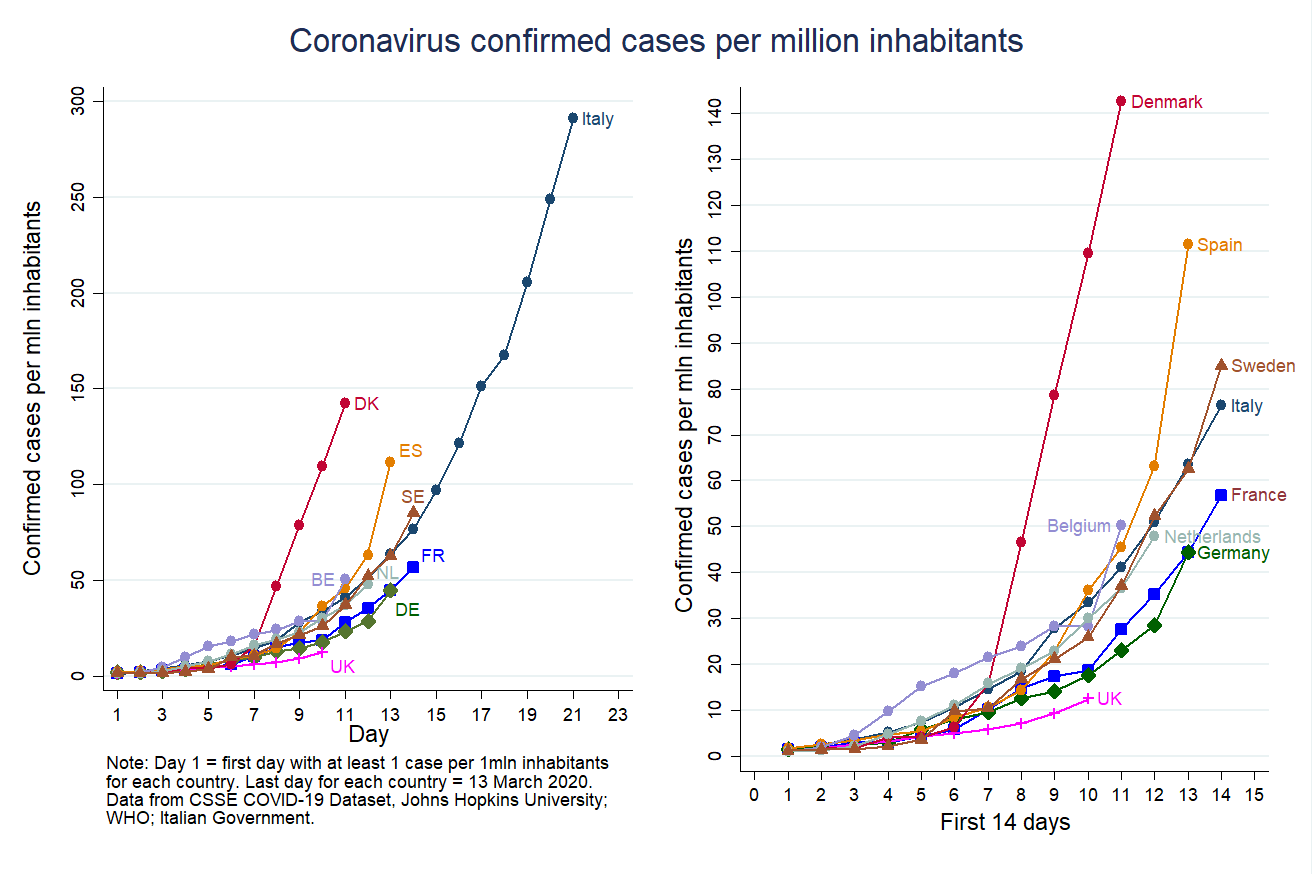 For each country, day 1 corresponds to the following dates: 22 February 2020 (Italy), 29 February (Austria, France, Sweden), 1 March (Germany, Spain), 2 March (Netherlands), 3 March (Belgium, Denmark), 4 March (UK).
Data are retrieved from CSSE COVID-19 Dataset (Johns Hopkins University), WHO, and the Italian Government (Protezione Civile). Population data are from 2013 census data.